
When you crawl a website with thousands (or hundreds of thousands) of pages, you can easily end up with a mess of data that’s extremely hard to comprehend, even if you know how to code. Data visualisation, though, makes it relatively simple to parse the results. This talk will explain how you can use tools to better understand what’s happening.
Overview
-
- Speaker: Anders Riise Koch
- Job role and company: Online Acquisition Manager at Rimowa
- Twitter profile: @whatsupanders
- LinkedIn profile: https://linkedin.com/in/andersriisekoch
- Link to the slides:
Simple ways to visualise your crawl data
Anders’ talk focused heavily on relaying technical data and information back to a client. Visualisation can help achieve this and there are a number of tools available that provide client-friendly visuals.
It’s not uncommon for clients to struggle to grasp technical SEO language and data. To combat this, it’s important for SEOs to create a story around the data to help the client related and understand the issue.

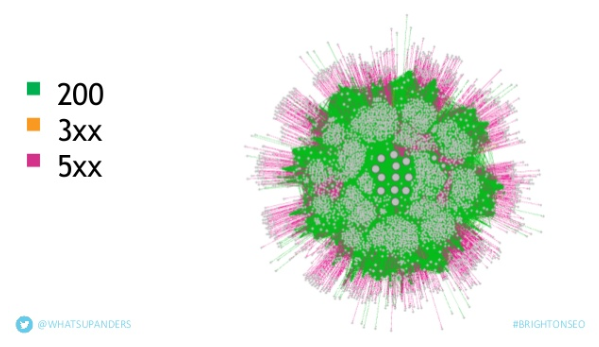
The first tool mentioned, Gephi, is one of the more advanced data visualisation tools but does boast some useful customisation options. Below you can see a visualisation of web page error codes using Gephi.
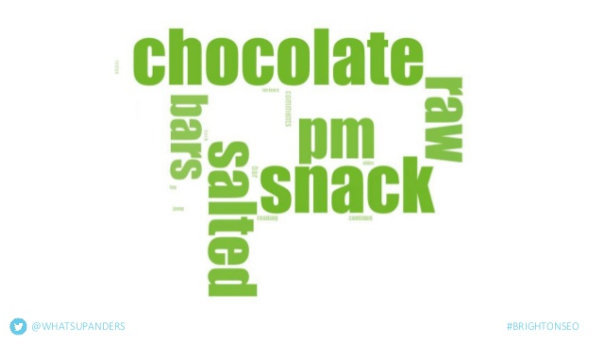
There is a less advanced option for the time-poor though. Screaming Frog actually has it’s own in-built visualisation menu which can be really handy for presenting crawl data to clients. Below is an example from Screaming Frog which visualises a page’s anchor texts.
Fave quote
“Visualisation is a tool to tell your story”.
Potential impact on the industry
It’s important for SEOs and marketers to put more effort into communicating technical data and issues with non-technical clients. Displaying technical data with client-friendly visualisation not only helps the client understand our struggle but will also help show the value in our work.
Key takeaways
- Tell a story around your data to help the client understand your point
- Gephi is a great advanced visualisation tool
- Screaming Frog has a built-in visualisation tool which is perfect for beginners
- Put more effort into helping non-technical clients understand the value of your work (and why it’s so important)